Features
See the top features of Epic Sum Up

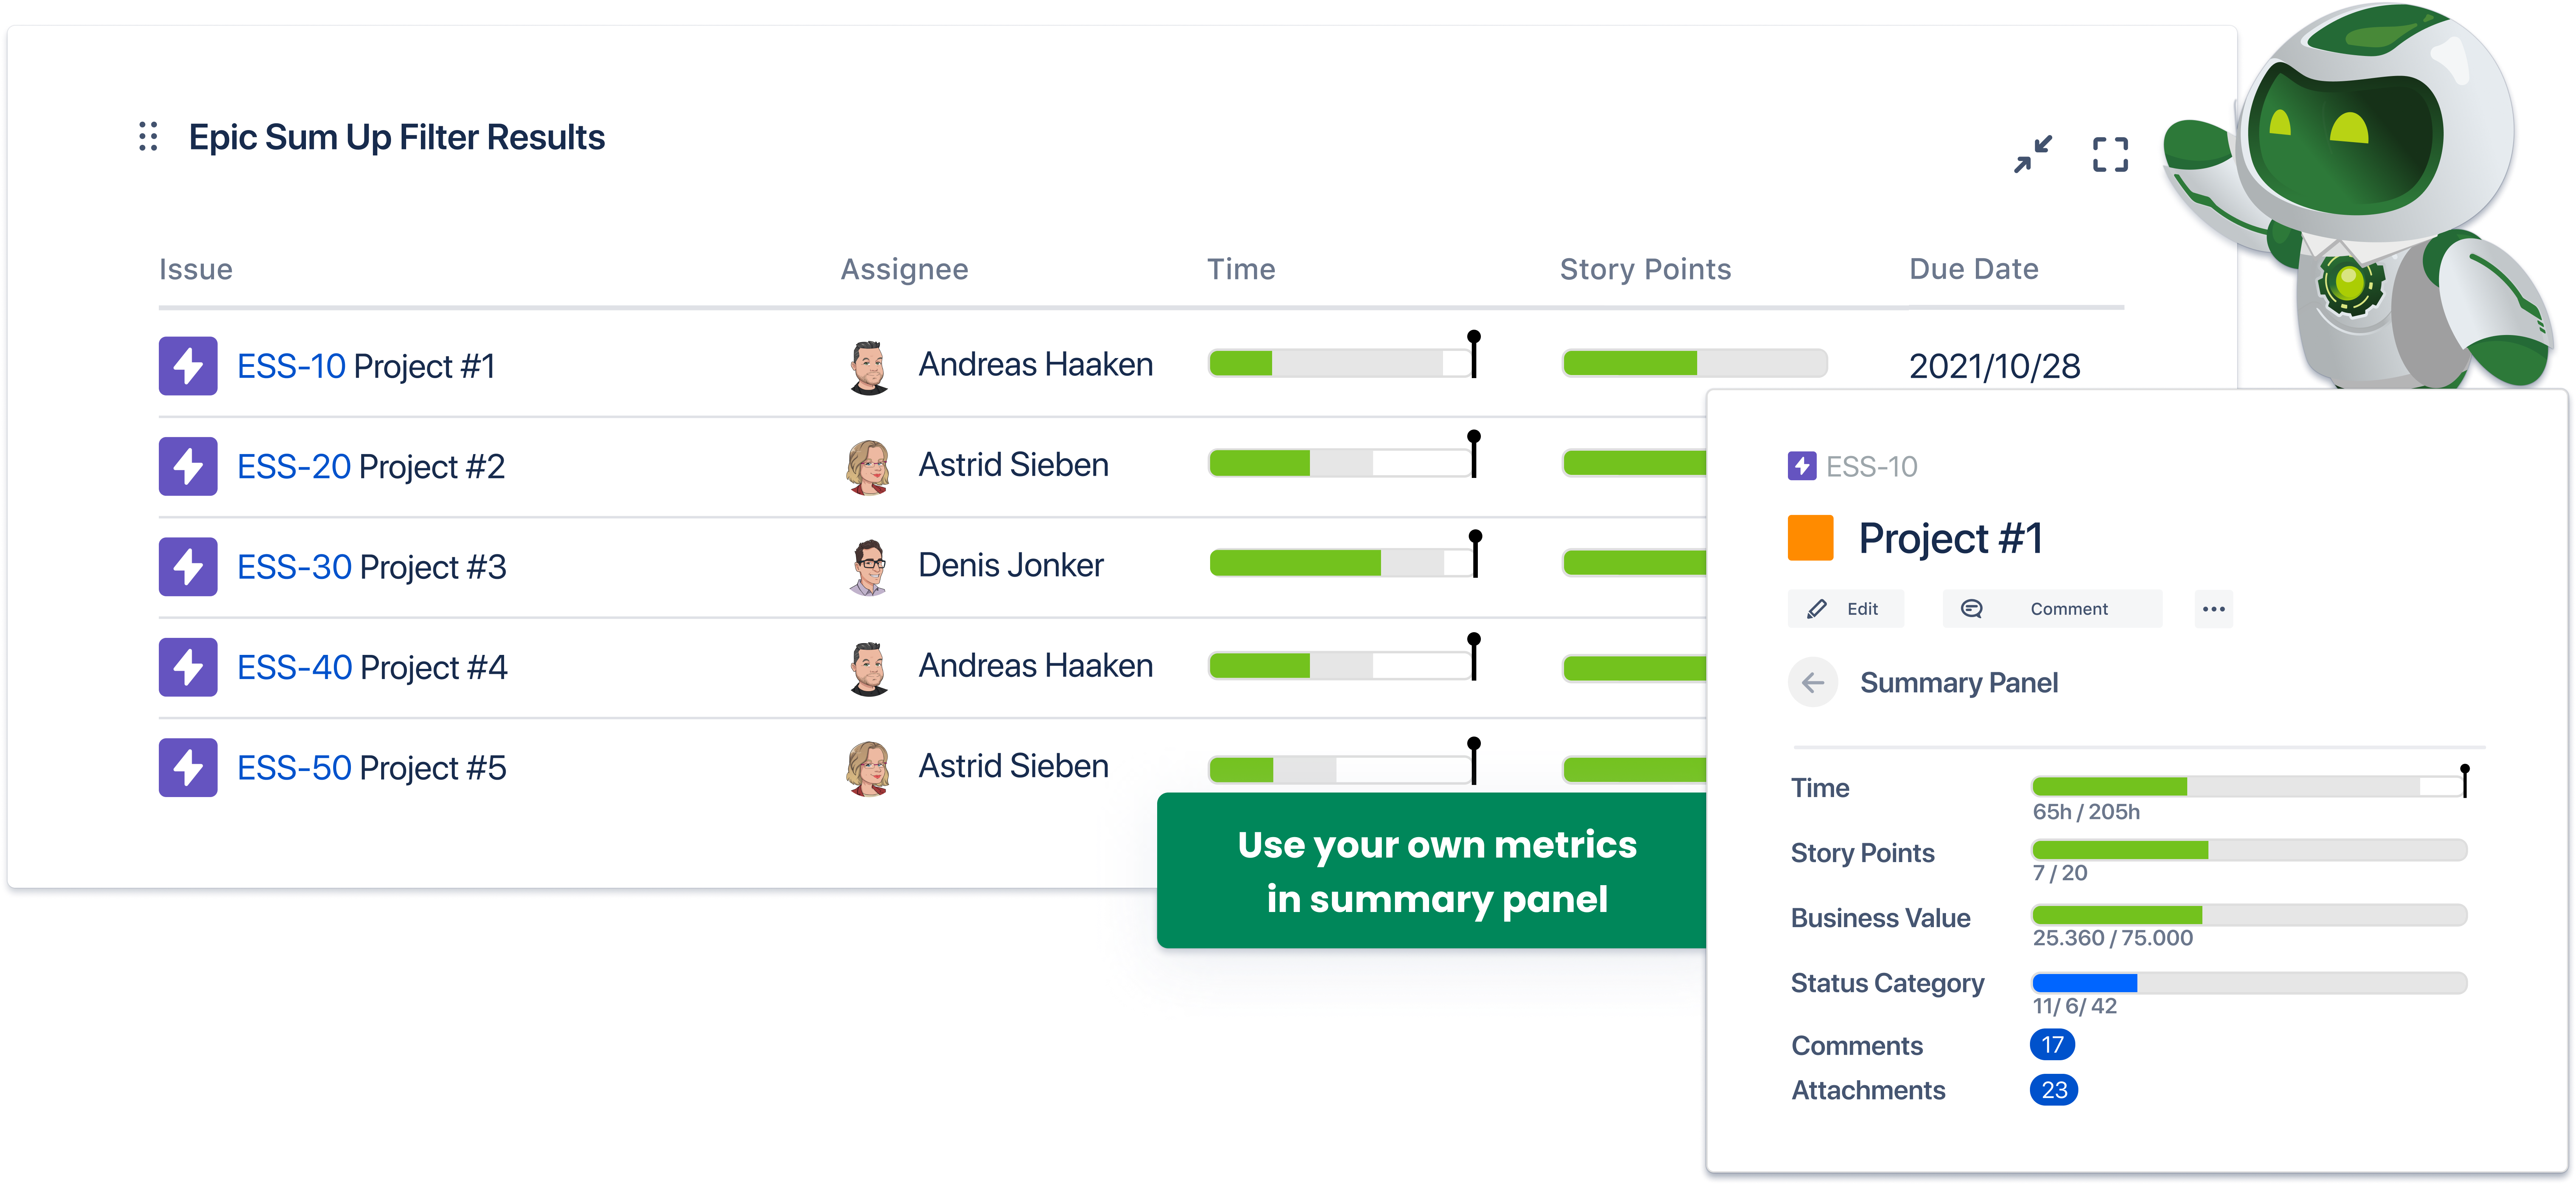
Real-time reporting
A clear overview of multiple projects.
See what’s inside epics, containers, subtasks and stories on one screen. Use progress bars on the Dashboard or in the Summary Panel to get an instant overview.
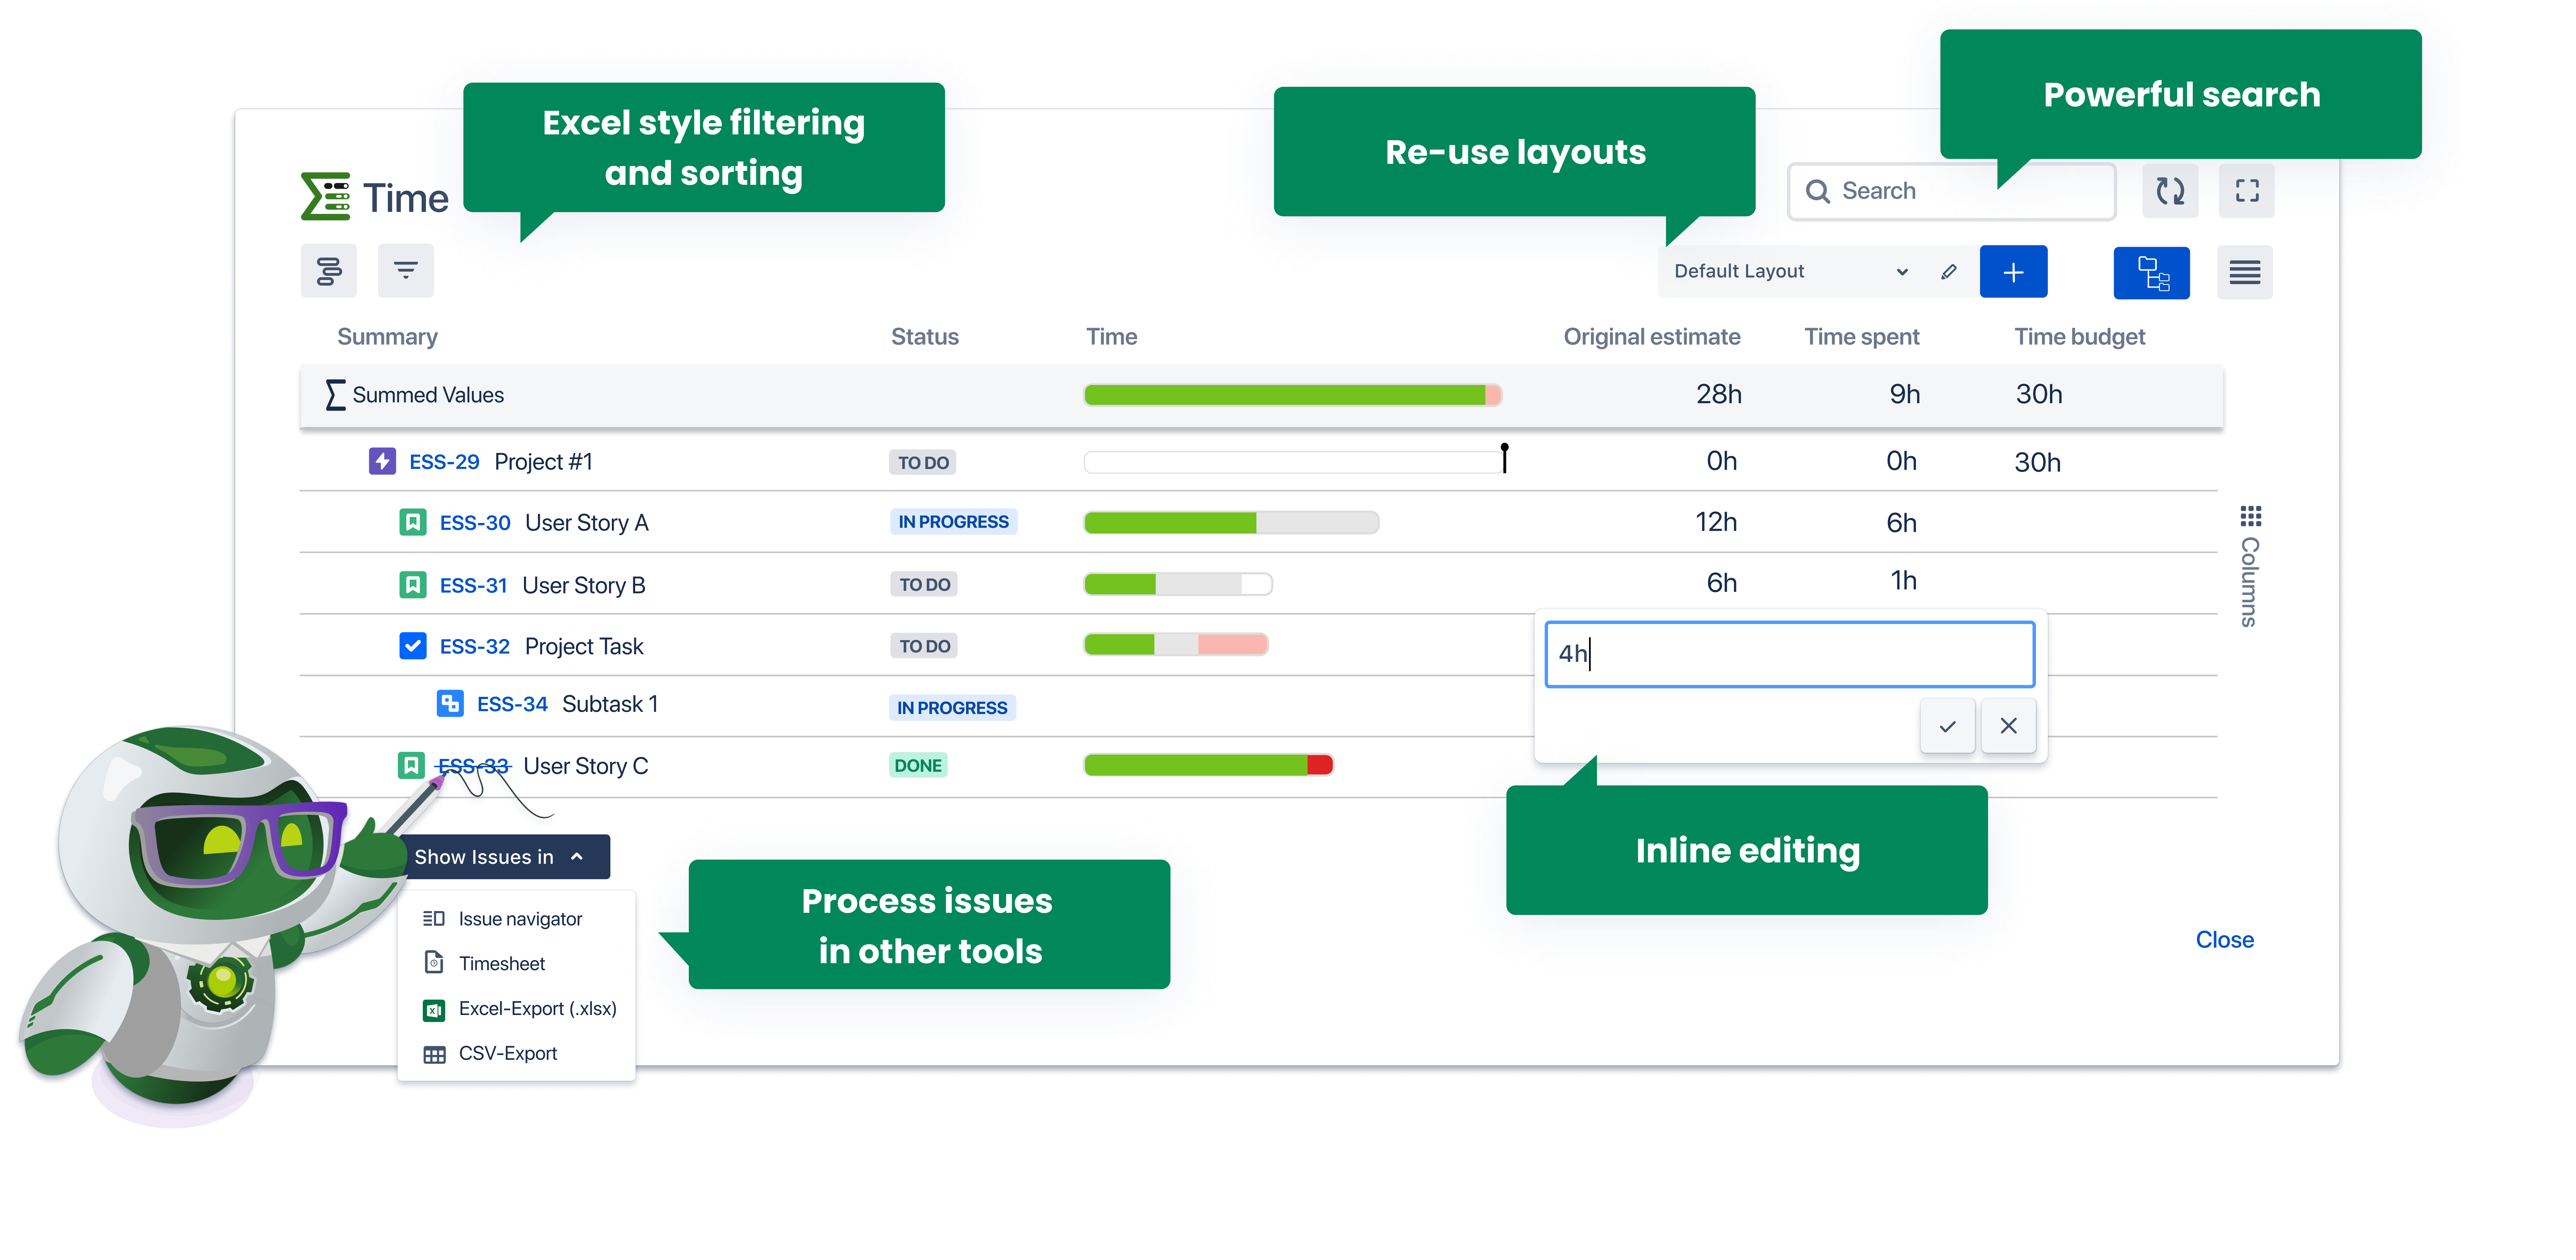
Quick editing of many issues at once
One click on any progress bar and then edit all summarized issues. Excel like editing makes it fast and easy.
- Copy and paste one or more values at once
- Edit multiple issues at once, avoid complicated bulk functions
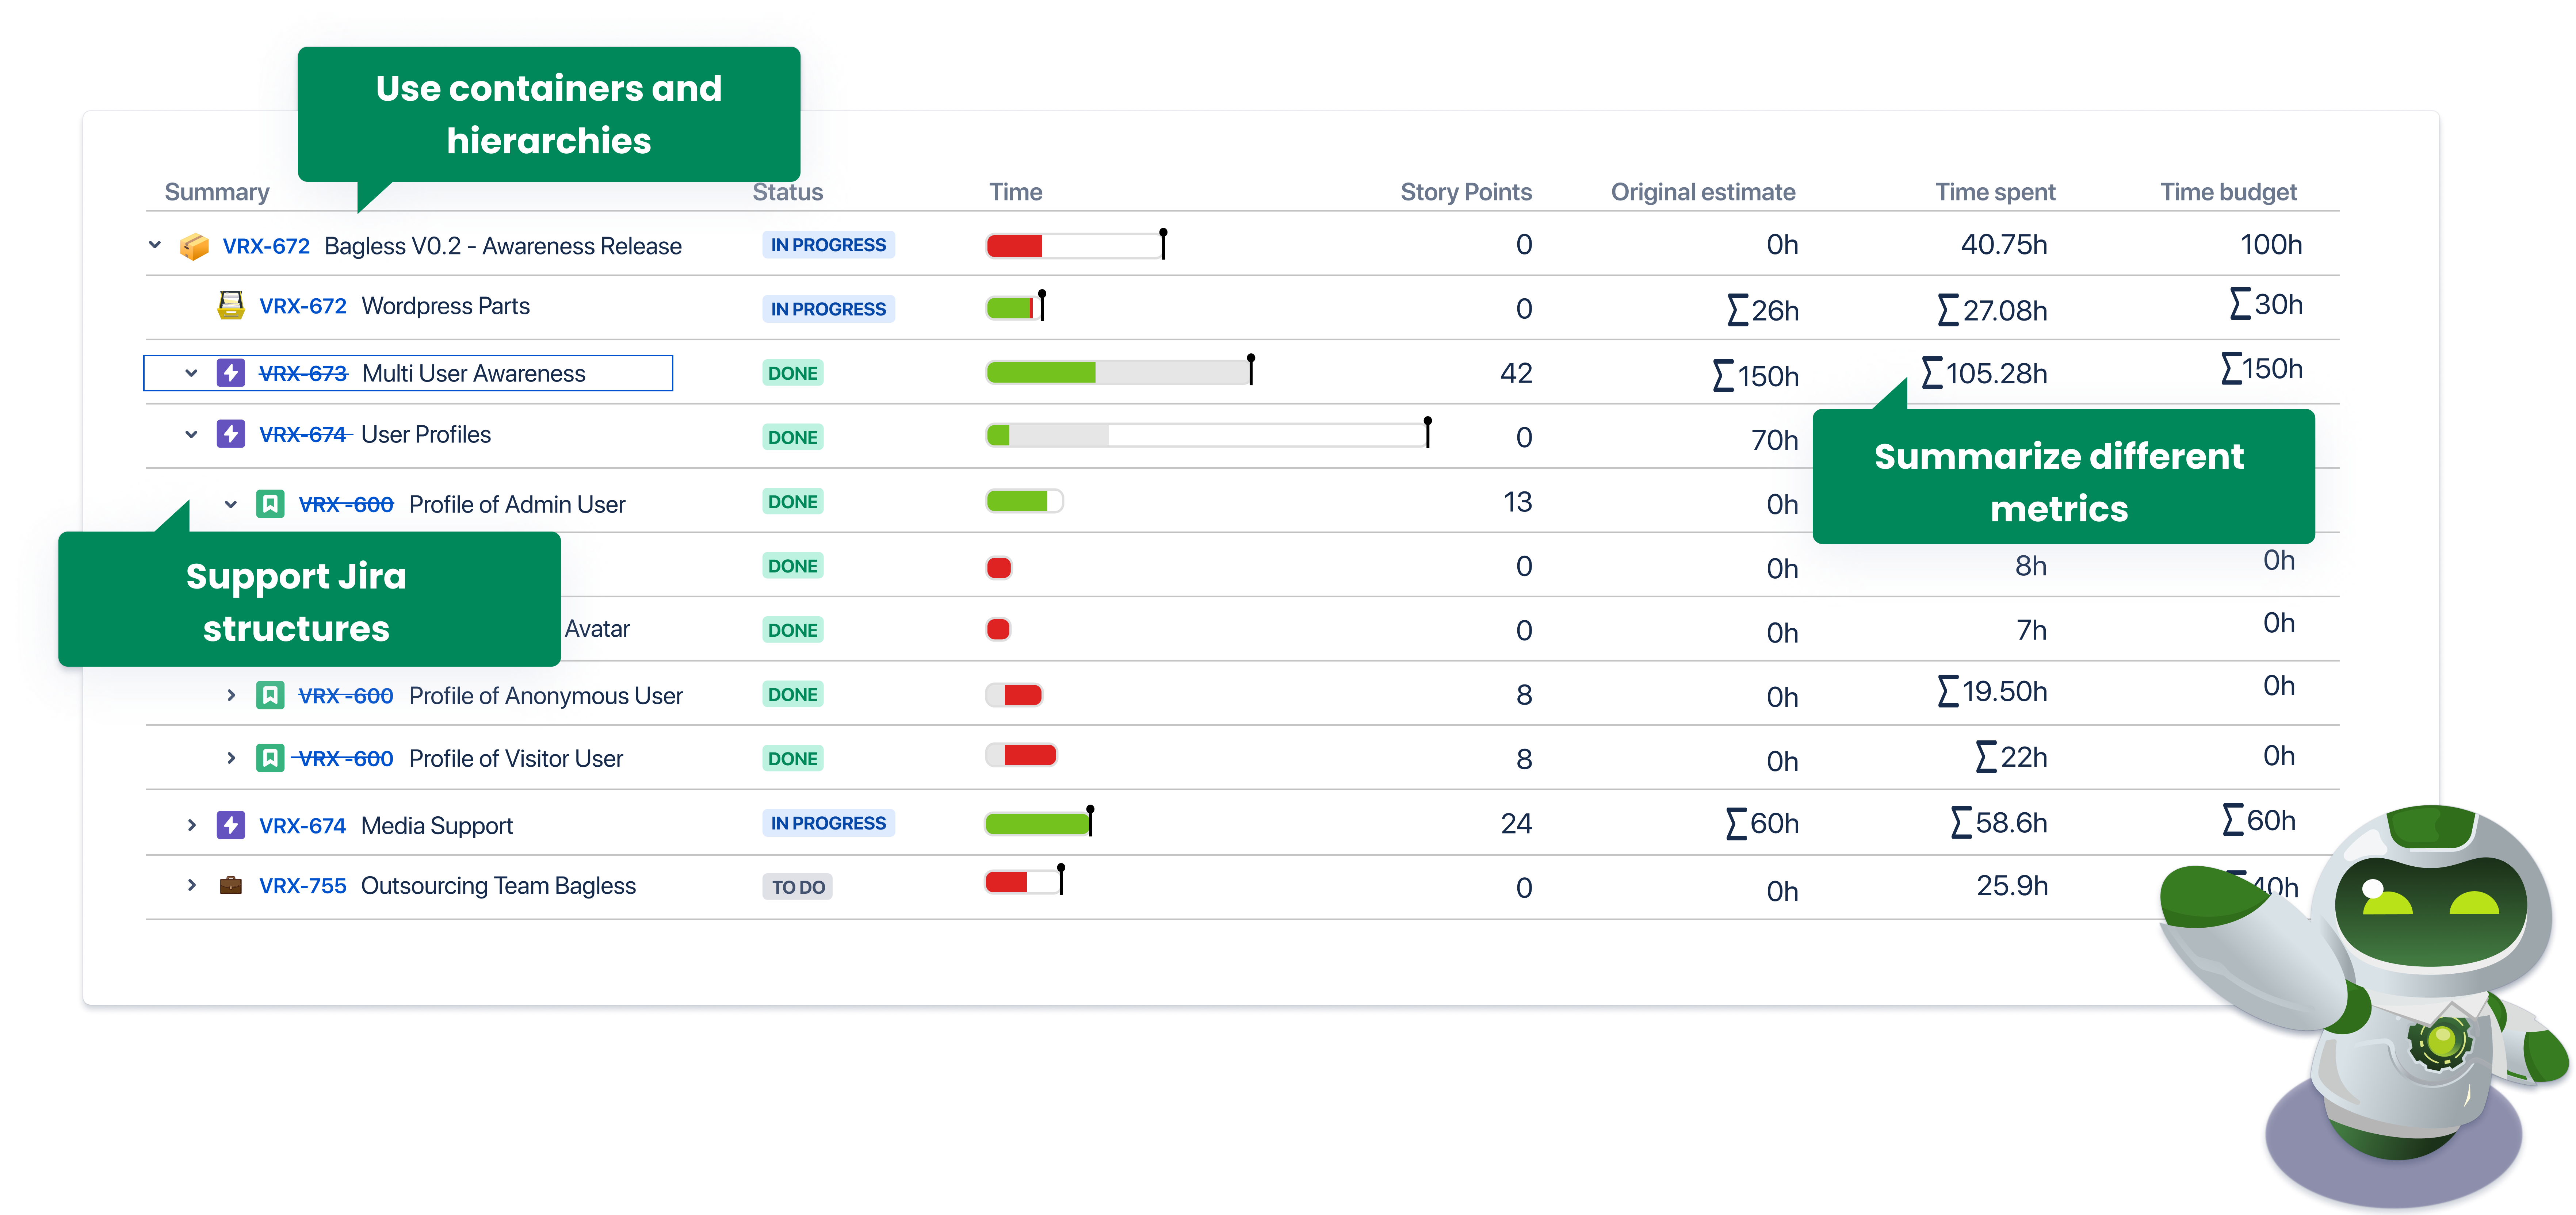
Better organizing
Group together work. Go beyond filters to better organize by harnessing the power of containers and epics.
- Create flexible and expandable structures
- Supports built-in Jira hierarchies
Reviews
on Atlassian Marketplace
on Atlassian Marketplace
on Atlassian Marketplace
Summary Panel Features
Comments & Attachments
See number of comments and
attachments in one list – not attached to individual issues.
Time Tracking
But together original estimate, remaining time, and logged time into one progress bar. This includes every issue in an epic or container.
Completed Issues
Display the progress of your epic by the number of resolved issues.
Budget Marker
Define budgets for every progress bar.
Calculated progress bar
Use simple values or custom fields to calculate your progress bar.
Sum Up a Numeric Value Like Story Points
Sum up values for different numeric fields and display them as progress bars.
Aggregation of Status Category
Aggregate status category for all issues in your epic. Similar to the release hub.
Detail View Editor Features
See All Issues In A Hierarchy
Opens the complete issue hierarchy from any progress bar (scrum board, agile board, dashboard, issue view, issue navigator).
Drill Down Everything
Expand, collapse or filter your hierarchy and see live aggregation results.
Advanced Inline Editing
Edit almost any value in your hierarchy inline or change everything in a column at once.
Simple Timesheet
Get an overview of all logged time for an epic and the issues inside the epic.
Dedicated Layouts
Define the column layout of the detail view. Store it and reuse it either for yourself or to share with your team.
Open Filter Result in Detail View
Think of it as an improved issue navigator. Get the detail view from the issue navigator or boards.
Custom Fields Features
*only available for Server and Data Center
Display Progress Bars in Custom Fields
Out of the box progress bars give you most of the custom fields you need. If not just create your own progress bars.
Use Custom Fields Everywhere
Display your progress bar anywhere (agile boards, scrum boards, issue view, issue navigator, dashboards or Confluence pages).
Display Aggregation Results Numbers
Define custom fields to display aggregation as numbers for an easy overview or export.
Drilldown From Anywhere
Click on any progress bars to open the Detail View to get an overview.
Can Be Used In Any Issue
Custom fields are not restricted to Epics or Containers. They can be used in any issue.
Container Features
*only available for Server and Data Center
Container Functions Beyond Epics
Put the container function into more than just epics.
Container in Container
Define different issuetypes to function as a container. Allows for stacking and more depth in hierarchies.
Issue Structure Flexibility
Build different issue structures in flexible hierarchy levels.
Overview of Epics (Initiatives)
Use issues as “initiatives” (like SAFe) as a collection of epics.
Mix Epic and Container Hierarchies
Create hierarchies of issues by mixing epics and containers.
Flexible Usage of Containers
Allow issues to become parents of other issues. Issues can be used as a folder, project, subproject or everything that can contain other issues.
Prices start from
$5 month
Need help? Start with our FAQs or Support page